Environmental monitoring for the 2021 construction includes water and air. Air monitoring is being performed around the secure landfill, Route 131 Staging Area, Haverstock Road Staging Area, and Alcoa East Plant dock during construction at those locations. Water monitoring is being performed in the river and at water intakes. These monitoring activities and results for April 2021 are summarized below. (Additional 2021 Lab Results: Current Month | April | May | June | July | August | September )
Air Monitoring - 2021 Secure Landfill Construction and Operation
Program includes particulate monitoring using real-time meters for particulates (or dust) and volatile organic compounds (VOCs) and sampling for PCB analytical testing. Corrective action levels have been established based on levels that are safe for the community for particulates, VOCs, and PCBs. The actual monitoring results are compared to the corrective action levels to determine if adjustments in construction are needed. The air monitoring locations and tabulated results are provided below.
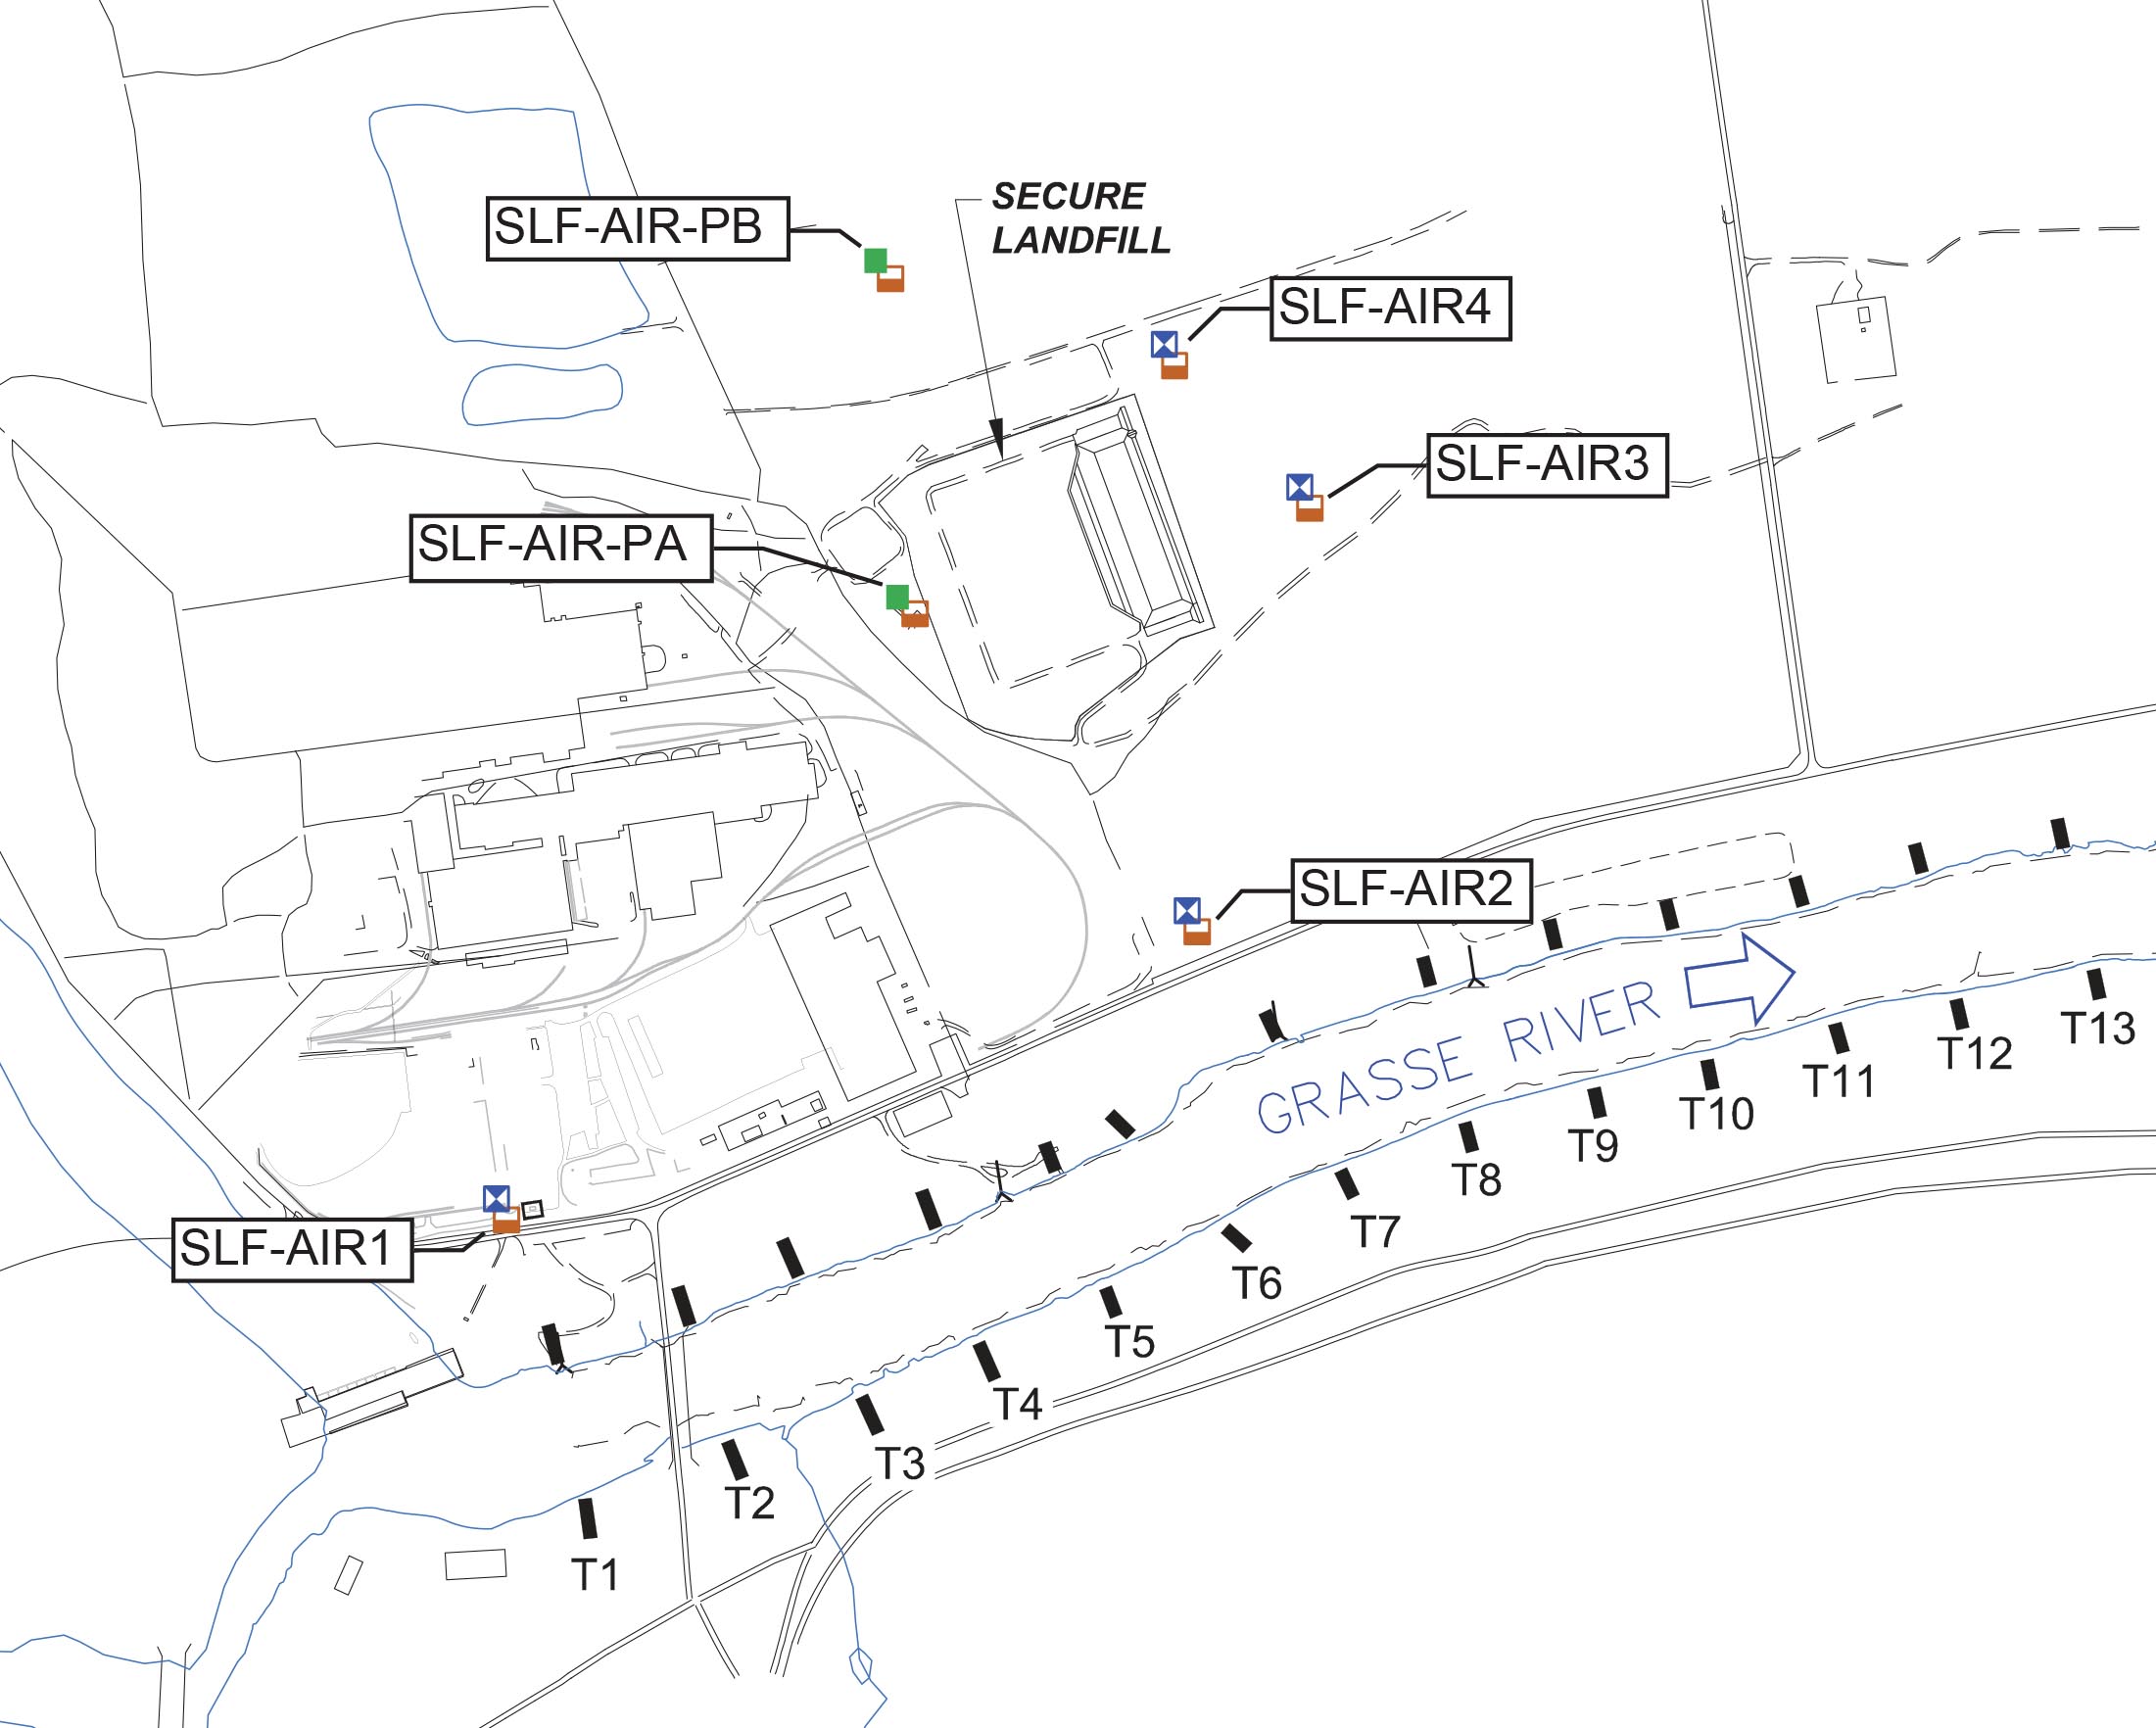
2021 Air Particulate Data (Corrective Action Level = 0.150 milligram per cubic meter above upwind location)
| Monitoring Station ID (see figure) | ||||||||
|---|---|---|---|---|---|---|---|---|
| Date | Action Level Check | SLF-AIR1 | SLF-AIR2 | SLF-AIR3 | SLF-AIR4 | SLF-AIR-PA | SLF-AIR-PB | Notes |
| April 28 | All Below | 0.0203 | 0.0284 | 0.0186 | 0.027 | 0.0325 | 0.0192 | -- |
| April 29 | All Below | 0.0219 | 0.0312 | 0.0138 | 0.0326 | 0.0143 | 0.0285 | -- |
| April 30 | All Below | 0.0251 | 0.0485 | 0.0203 | 0.0431 | 0.039 | 0.0408 | -- |
NA = Data not collected in accordance with plan
Particulates (milligrams per cubic meter)
Return to top for lab results from previous months
2021 Air Volatile Organic Compound Data (Corrective Action Level = 25 ppm above upwind location)
| Monitoring Station ID (see figure) | ||||||||
|---|---|---|---|---|---|---|---|---|
| Date | Action Level Check | SLF-AIR1 | SLF-AIR2 | SLF-AIR3 | SLF-AIR4 | SLF-AIR-PA | SLF-AIR-PB | Notes |
| April 28 | All Below | 0.0039 | 0 | 0.0001 | 0.0957 | 0.0812 | 0.0192 | -- |
| April 29 | All Below | 0.0202 | 0.0001 | 0 | 0.1142 | 0.0455 | 0.0285 | -- |
| April 30 | All Below | 0.0418 | 0.0367 | 0.004 | 0.1144 | 0.0014 | 0.0408 | -- |
NA = Data not collected in accordance with plan
Volatile Organic Compounds (VOCs parts per million)
Return to top for lab results from previous months
2021 Air PCB Data (Corrective Action Level = 0.100 microgram per cubic meter)
| Monitoring Station ID (see figure) | ||||||||
|---|---|---|---|---|---|---|---|---|
| Date | Action Level Check | SLF-AIR1 | SLF-AIR2 | SLF-AIR3 | SLF-AIR4 | SLF-AIR-PA | SLF-AIR-PB | Notes |
| April 28 | All Below | 0.000250 | 0.000510 | 0.000320 | 0.000230 | Below detectable levels | Below detectable levels | -- |
| April 29 | All Below | 0.000410 | 0.000380 | 0.000350 | 0.000260 | Below detectable levels | Below detectable levels | -- |
| April 30 | All Below | 0.000340 | 0.000470 | 0.000420 | 0.000360 | Below detectable levels | Below detectable levels | -- |
NA = Analysis not required in accordance with plan
Total PCBs (micrograms per cubic meter)
Return to top for lab results from previous months
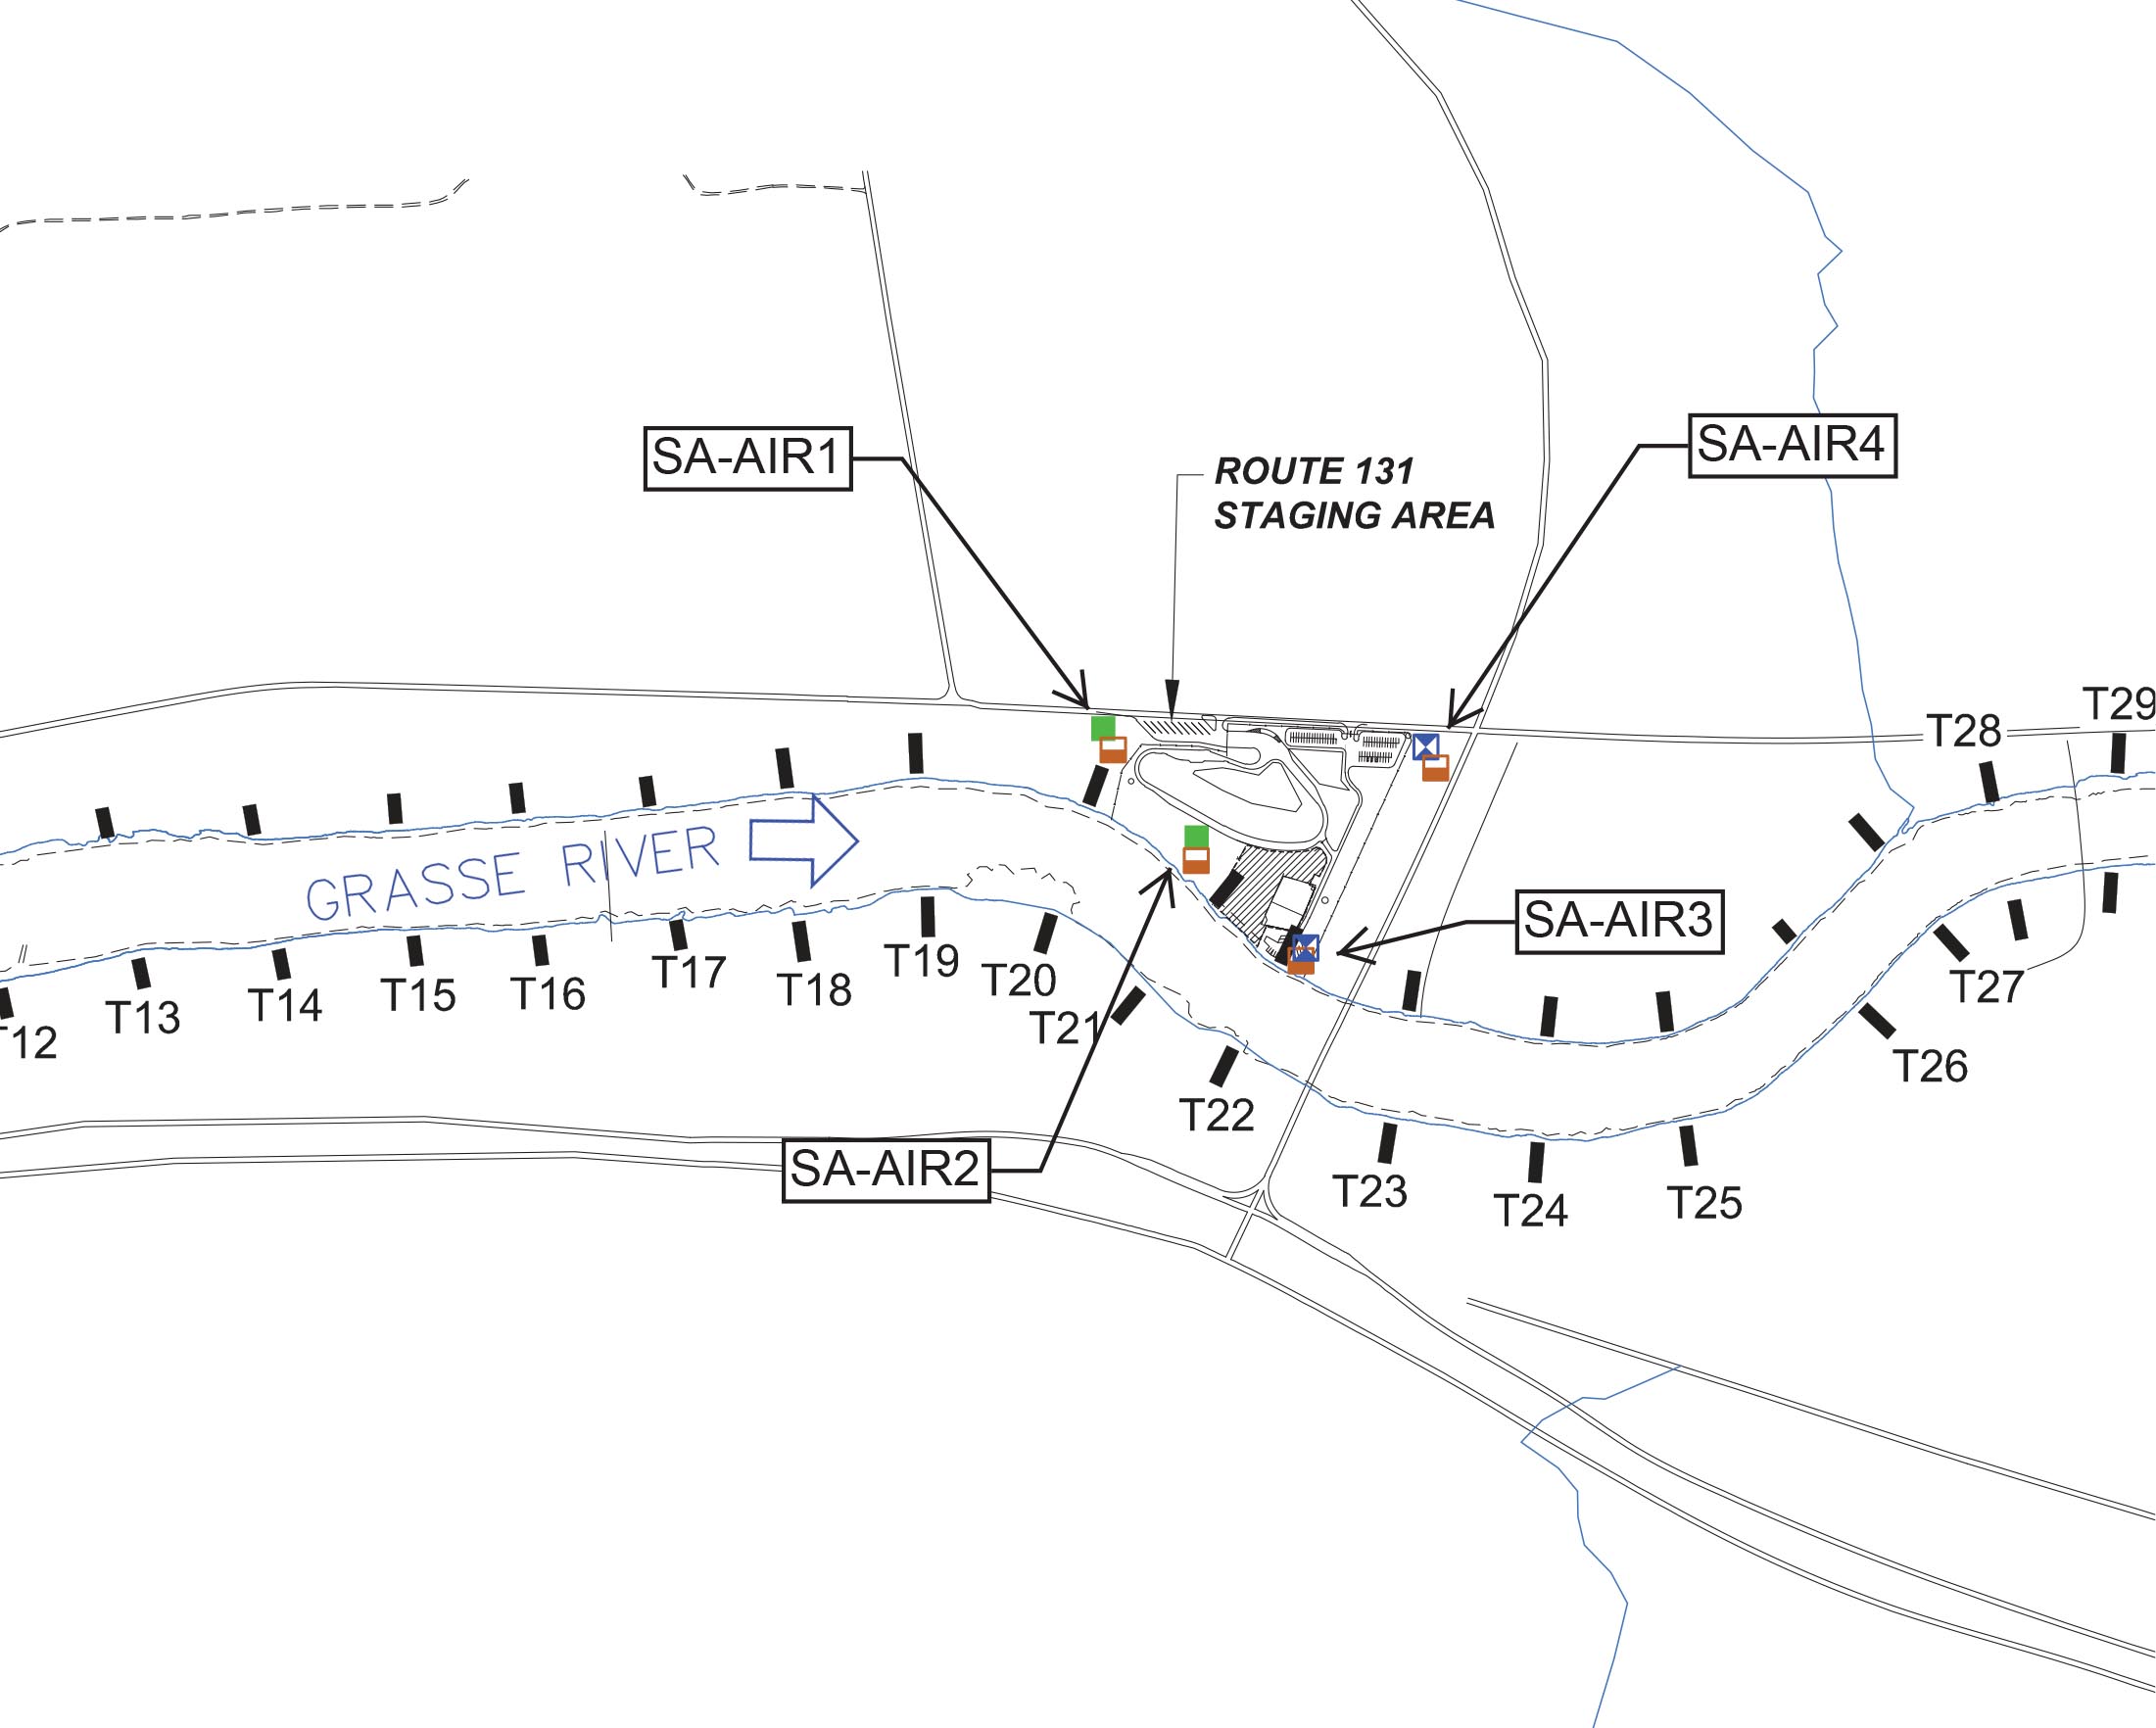
Air Monitoring - 2021 Route 131 Staging Area
Program includes particulate monitoring using real-time meters for particulates (or dust) and volatile organic compounds (VOCs) and sampling for PCB analytical testing during handling of potential PCB-containing material. Corrective action levels have been established based on levels that are safe for the community for particulates, VOCs, and PCBs. The actual monitoring results are compared to the corrective action levels to determine if adjustments in construction are needed. The air monitoring locations and tabulated results are provided below.
2021 Air Particulate Data (Corrective Action Level = 0.150 milligram per cubic meter above upwind location)
| Monitoring Station ID (see figure) | ||||||
|---|---|---|---|---|---|---|
| Date | Action Level Check | SA-AIR1 | SA-AIR2 | SA-AIR3 | SA-AIR4 | Notes |
| April 6 | All Below | 0.006 | 0.007 | 0.0214 | 0.0155 | -- |
| April 7 | All Below | 0.0173 | 0.0103 | 0.0228 | 0.0169 | -- |
| April 8 | All Below | 0.0151 | 0.0076 | 0.0393 | 0.0353 | -- |
| April 9 | All Below | 0.014 | 0.007 | 0.0391 | 0.0323 | -- |
| April 10 | All Below | 0.0172 | 0.0053 | 0.0218 | 0.015 | -- |
| April 11 | All Below | 0.043 | 0.032 | 0.0416 | 0.0362 | -- |
| April 12 | All Below | 0.0086 | 0.0148 | 0.0141 | 0.0104 | -- |
| April 13 | All Below | 0.0034 | 0.0148 | 0.0131 | 0.0078 | -- |
| April 14 | All Below | 0.0076 | 0.0134 | 0.02 | 0.0149 | -- |
| April 15 | All Below | 0.0098 | 0.0148 | 0.0209 | 0.0143 | -- |
| April 16 | All Below | 0.0318 | 0.0291 | 0.0437 | 0.0379 | -- |
| April 17 | All Below | 0.009 | 0.0151 | 0.0231 | 0.0148 | -- |
| April 18 | All Below | 0.0192 | 0.0221 | 0.0296 | 0.024 | -- |
| April 19 | All Below | 0.015 | 0.0197 | 0.0246 | 0.0193 | -- |
| April 20 | All Below | 0.0232 | 0.0209 | 0.0261 | 0.0235 | -- |
| April 21 | All Below | 0.0012 | 0.0123 | 0.0166 | 0.013 | -- |
| April 22 | All Below | 0.001 | 0.0122 | 0.02 | 0.0087 | -- |
| April 23 | All Below | 0.0074 | 0.0184 | 0.024 | 0.0162 | -- |
| April 24 | All Below | 0.0221 | 0.0292 | 0.0344 | 0.0334 | -- |
| April 25 | All Below | 0.0275 | 0.0272 | 0.0346 | 0.0325 | -- |
| April 26 | All Below | 0.0194 | 0.0234 | 0.0298 | 0.0261 | -- |
| April 27 | All Below | 0.0175 | 0.0166 | 0.047 | 0.0212 | -- |
| April 28 | All Below | 0.0114 | 0.0232 | 0.0794 | 0.0311 | -- |
| April 29 | All Below | 0.0282 | 0.0265 | 0.0256 | 0.0239 | -- |
| April 30 | All Below | 0.0337 | 0.0273 | 0.0401 | 0.0349 | -- |
NA = Data not collected in accordance with plan
Particulates (milligrams per cubic meter)
Return to top for lab results from previous months
2021 Air Volatile Organic Compound Data (Corrective Action Level = 25 ppm above upwind location)
| Monitoring Station ID (see figure) | ||||||
|---|---|---|---|---|---|---|
| Date | Action Level Check | SA-AIR1 | SA-AIR2 | SA-AIR3 | SA-AIR4 | Notes |
| April 27 | All Below | 0 | 0 | 0.0174 | 0.0392 | -- |
| April 28 | All Below | 0.0244 | 0.0189 | 0.1221 | 0.0483 | -- |
| April 29 | All Below | 0.0052 | 0.0276 | 0 | 0.0419 | -- |
| April 30 | All Below | 0.0004 | 0.0029 | 0 | 0 | -- |
NA = Data not collected in accordance with plan
Volatile Organic Compounds (VOCs parts per million)
Return to top for lab results from previous months
2021 Air PCB Data (Corrective Action Level = 0.100 microgram per cubic meter)
| Monitoring Station ID (see figure) | ||||||
|---|---|---|---|---|---|---|
| Date | Action Level Check | SA-AIR1 | SA-AIR2 | SA-AIR3 | SA-AIR4 | Notes |
| April 28 | All Below | Below detectable levels | Below detectable levels | 0.000170 | 0.000200 | -- |
| April 29 | All Below | Below detectable levels | Below detectable levels | 0.000390 | 0.000390 | -- |
| April 30 | All Below | Below detectable levels | Below detectable levels | 0.000480 | 0.000350 | -- |
NA = Analysis not required in accordance with plan
Total PCBs (micrograms per cubic meter)
Return to top for lab results from previous months
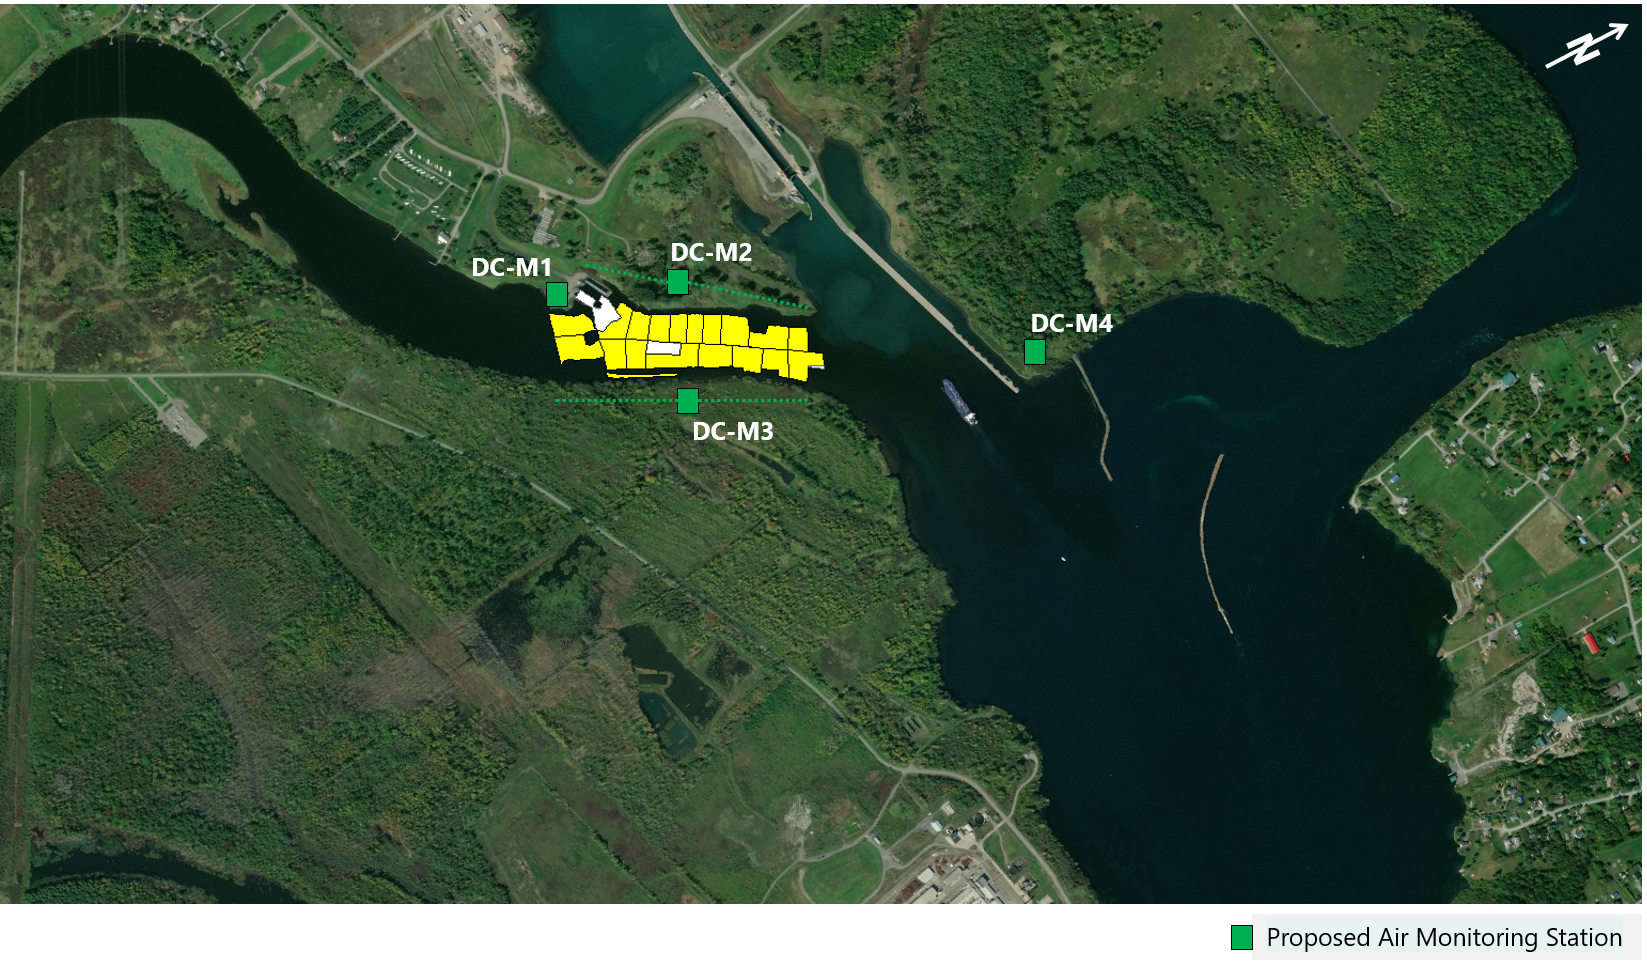
Air Monitoring - 2021 Dredge Mobile River Stations
Program includes sampling for PCB analytical testing. The corrective action level has been established based on a level that is safe for the community. The actual monitoring results are compared to the corrective action level to determine if adjustments in construction are needed. The air monitoring locations and tabulated results are provided below.
2021 Air PCB Data (Corrective Action Level = 0.100 microgram per cubic meter)
| Monitoring Station ID (see figure) | ||||||
|---|---|---|---|---|---|---|
| Date | Action Level Check | DC-M1 | DC-M2 | DC-M3 | DC-M4 | Notes |
| April 27 | All Below | Below detectable levels | Below detectable levels | Below detectable levels | Below detectable levels | -- |
| April 28 | All Below | Below detectable levels | Below detectable levels | Below detectable levels | Below detectable levels | -- |
| April 29 | All Below | Below detectable levels | Below detectable levels | Below detectable levels | Below detectable levels | -- |
| April 30 | All Below | Below detectable levels | Below detectable levels | Below detectable levels | Below detectable levels | -- |
NA = Analysis not required in accordance with plan
Total PCBs (micrograms per cubic meter)
Return to top for lab results from previous months
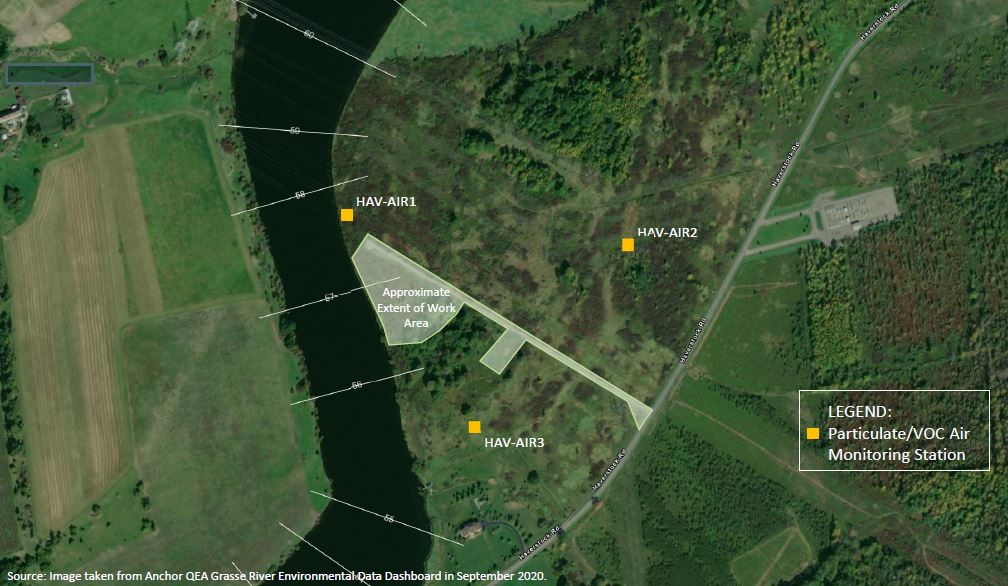
Air Monitoring - 2021 Haverstock Road Support Area
Program includes particulate monitoring using real-time meters for particulates (or dust). The corrective action level has been established based on a level that is safe for the community. The actual monitoring results are compared to the corrective action level to determine if adjustments in construction are needed. The air monitoring locations and tabulated results are provided below.
2021 Air Particulate Data (Corrective Action Level = 0.150 milligram per cubic meter above upwind location)
| Monitoring Station ID (see figure) | |||||
|---|---|---|---|---|---|
| Date | Action Level Check | HAV-AIR1 | HAV-AIR2 | HAV-AIR3 | Notes |
| April 22 | All Below | 0.0054 | 0.0087 | 0.0057 | -- |
| April 23 | All Below | 0.0041 | 0.0133 | 0.0106 | -- |
| April 24 | All Below | 0.0222 | 0.0295 | 0.0238 | -- |
| April 25 | All Below | 0.0343 | 0.0265 | 0.0244 | -- |
| April 26 | All Below | 0.033 | 0.0235 | 0.0211 | -- |
| April 27 | All Below | 0.011 | 0.03 | 0.005 | -- |
| April 28 | All Below | 0.0089 | 0.0188 | 0.0072 | -- |
| April 29 | All Below | 0.0148 | 0.0298 | 0.0237 | -- |
| April 30 | All Below | 0.0171 | 0.0368 | 0.029 | -- |
NA = Data not collected in accordance with plan
Particulates (milligrams per cubic meter)
Return to top for lab results from previous months
Air Monitoring - 2021 Alcoa East Plant Dock Area
Program includes particulate monitoring using real-time meters for particulates (or dust). The corrective action level has been established based on a level that is safe for the community. The actual monitoring results are compared to the corrective action level to determine if adjustments in construction are needed. The air monitoring locations and tabulated results are provided below. Monitoring is only performed when there is active work at this area.
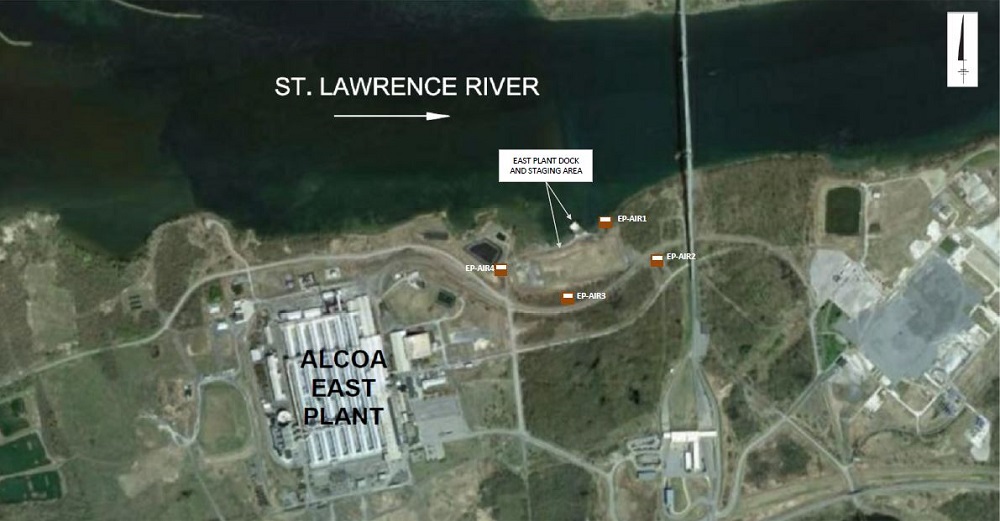
2021 Air Particulate Data (Corrective Action Level = 0.150 milligram per cubic meter above upwind location)
| Monitoring Station ID (see figure) | ||||||
|---|---|---|---|---|---|---|
| Date | Action Level Check | EP-AIR1 | EP-AIR2 | EP-AIR3 | EP-AIR4 | Notes |
| April 15 | All Below | 0.0209 | 0.0268 | 0.0169 | 0.01033 | -- |
| April 16 | All Below | 0.031 | 0.0303 | 0.0323 | 0.042 | -- |
| April 17 | All Below | 0.0144 | 0.0131 | 0.0142 | 0.0181 | -- |
| April 18 | All Below | 0.0216 | 0.0206 | 0.0224 | 0.0272 | -- |
| April 19 | All Below | 0.0177 | 0.0167 | 0.0174 | 0.0193 | -- |
| April 20 | All Below | 0.0293 | 0.0197 | 0.0152 | 0.0163 | -- |
| April 21 | All Below | 0.0231 | 0.0117 | 0.0126 | 0.0137 | -- |
| April 22 | All Below | 0.0117 | 0.0075 | 0.0083 | 0.0123 | -- |
| April 23 | All Below | 0.0089 | 0.0115 | 0.0112 | 0.0143 | -- |
| April 24 | All Below | 0.0242 | 0.025 | 0.0263 | 0.0293 | -- |
| April 25 | All Below | 0.0492 | 0.025 | 0.0257 | 0.0439 | -- |
| April 26 | All Below | 0 | 0.0218 | 0.0252 | 0.0285 | -- |
NA = Data not collected in accordance with plan
Particulates (milligrams per cubic meter)
Return to top for lab results from previous months
Water Monitoring - 2021 River Remediation
Program includes turbidity monitoring using real-time meters for solids and PCB analytical testing at the water intake locations and total suspended solids (TSS) and PCB analytical testing at the river locations. Corrective action levels have been established based on levels that are safe for the community for both solids and PCBs. The actual monitoring results will be compared to the corrective action levels to determine if adjustments in construction are needed. The water locations and tabulated results are provided below.
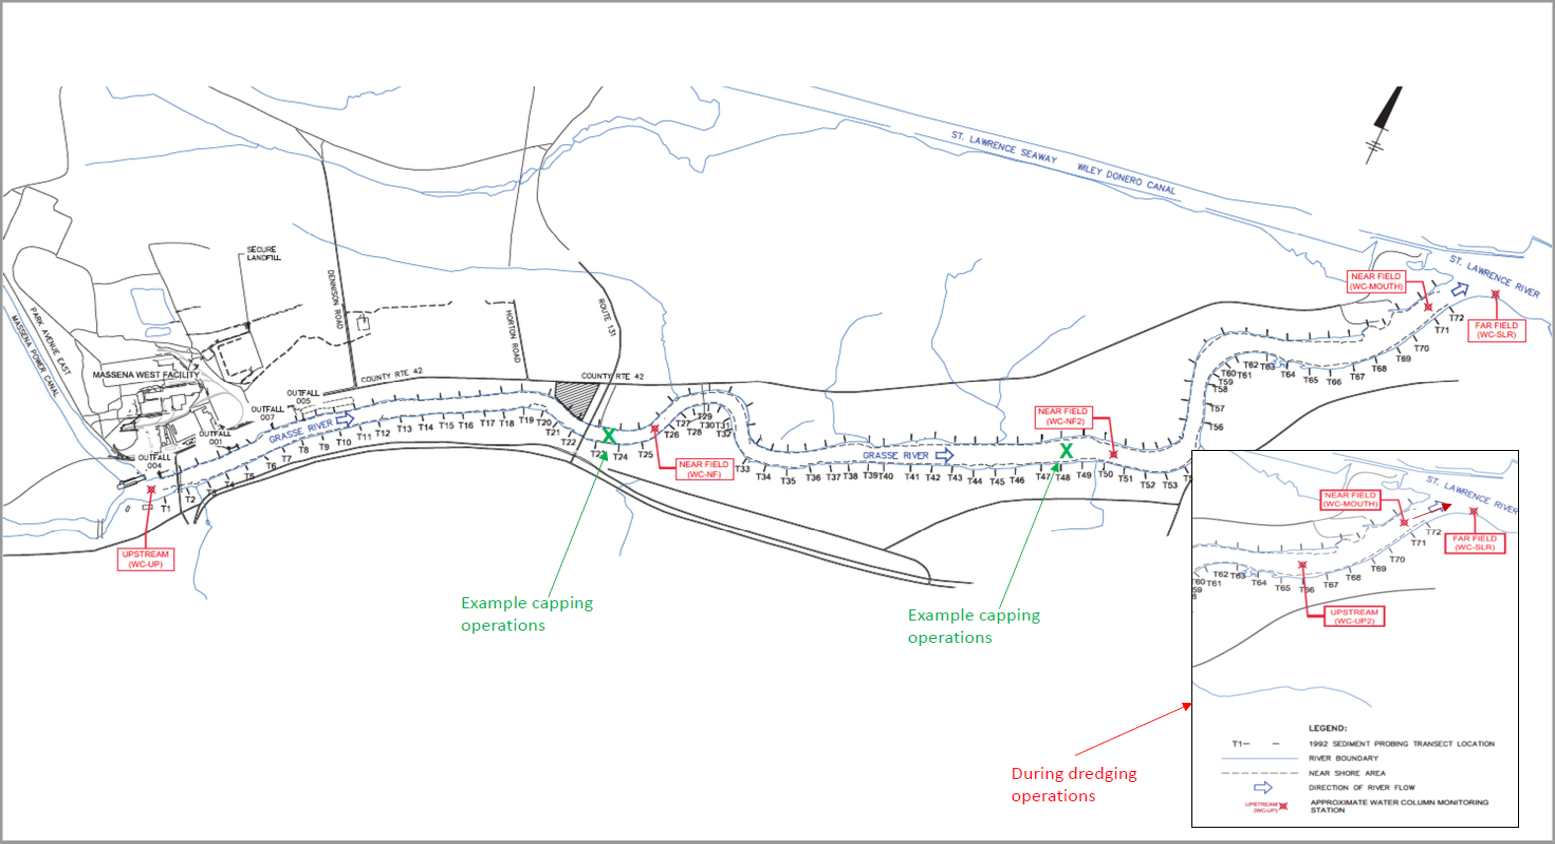
2021 Water Column Total Suspended Solids Data (Corrective Action Level = 100 mg/L above WC-UP Level at WC-SLR)
| Monitoring Station ID (see figure) | |||||||
|---|---|---|---|---|---|---|---|
| Date | Action Level Check | WC-UP1 | WC-NF2 | WC-NF | WC-MOUTH | WC-SLR | Notes |
| April 6 | All Below | Below detectable levels | NA | Below detectable levels | Below detectable levels | Below detectable levels | -- |
| April 7 | All Below | Below detectable levels | NA | Below detectable levels | Below detectable levels | Below detectable levels | -- |
| April 8 | All Below | Below detectable levels | NA | 5.1 | Below detectable levels | Below detectable levels | -- |
| April 9 | All Below | Below detectable levels | NA | Below detectable levels | 5.8 | Below detectable levels | -- |
| April 10 | All Below | Below detectable levels | NA | Below detectable levels | 5.8 | 5.0 | -- |
| April 12 | All Below | Below detectable levels | NA | 8.1 | 8.3 | 8.7 | -- |
| April 13 | All Below | Below detectable levels | NA | 10 | 6.5 | 5.1 | -- |
| April 14 | All Below | Below detectable levels | NA | 6.6 | 7.6 | Below detectable levels | -- |
| April 15 | All Below | Below detectable levels | Below detectable levels | Below detectable levels | NA | Below detectable levels | -- |
| April 16 | All Below | Below detectable levels | Below detectable levels | 5.0 | NA | 5.5 | -- |
| April 17 | All Below | Below detectable levels | 8.0 | 7.8 | NA | Below detectable levels | -- |
| April 19 | All Below | 11 | 7.1 | 7.5 | NA | Below detectable levels | -- |
| April 20 | All Below | Below detectable levels | 12 | 6.7 | NA | Below detectable levels | -- |
| April 21 | All Below | Below detectable levels | 5.9 | 7.3 | NA | 7.0 | -- |
| April 22 | All Below | Below detectable levels | 11 | 8.3 | NA | 7.5 | -- |
| April 23 | All Below | Below detectable levels | 14 | 6.7 | NA | 6.5 | -- |
| April 24 | All Below | Below detectable levels | 5.8 | 7.0 | NA | 6.2 | -- |
| April 26 | All Below | Below detectable levels | NA | Below detectable levels | 8.0 | 5.8 | -- |
| April 27 | All Below | Below detectable levels | 27 | 6.6 | NA | 7.6 | -- |
| April 28 | All Below | Below detectable levels | 5.2 | 7.1 | NA | 7.2 | -- |
| April 29 | All Below | Below detectable levels | 14 | 9.3 | NA | 7.0 | -- |
| April 30 | All Below | Below detectable levels | 16 | 6.3 | NA | 5.4 | -- |
Total Suspended Solids (TSS; milligrams per liter)
Return to top for lab results from previous months
2021 Water Column PCB Data (Corrective Action Level at WC-SLR = 0.5 microgram per liter)
| Monitoring Station ID (see figure) | |||||||
|---|---|---|---|---|---|---|---|
| Date | Action Level Check | WC-UP2 | WC-NF2 | WC-NF | WC-MOUTH | WC-SLR | Notes |
| April 6 | All Below | NA | NA | Below detectable levels | Below detectable levels | Below detectable levels | -- |
| April 7 | All Below | NA | NA | Below detectable levels | Below detectable levels | Below detectable levels | -- |
| April 8 | All Below | NA | NA | Below detectable levels | Below detectable levels | Below detectable levels | -- |
| April 9 | All Below | NA | NA | Below detectable levels | Below detectable levels | Below detectable levels | -- |
| April 10 | All Below | NA | NA | Below detectable levels | Below detectable levels | Below detectable levels | -- |
| April 12 | All Below | NA | NA | Below detectable levels | Below detectable levels | Below detectable levels | -- |
| April 13 | All Below | NA | NA | Below detectable levels | Below detectable levels | Below detectable levels | -- |
| April 14 | All Below | NA | NA | Below detectable levels | Below detectable levels | Below detectable levels | -- |
| April 15 | All Below | NA | Below detectable levels | Below detectable levels | NA | Below detectable levels | -- |
| April 16 | All Below | NA | Below detectable levels | Below detectable levels | NA | Below detectable levels | -- |
| April 17 | All Below | NA | Below detectable levels | Below detectable levels | NA | Below detectable levels | -- |
| April 19 | All Below | NA | Below detectable levels | Below detectable levels | NA | Below detectable levels | -- |
| April 20 | All Below | NA | Below detectable levels | Below detectable levels | NA | Below detectable levels | -- |
| April 21 | All Below | NA | Below detectable levels | Below detectable levels | NA | Below detectable levels | -- |
| April 22 | All Below | NA | Below detectable levels | Below detectable levels | NA | Below detectable levels | -- |
| April 23 | All Below | NA | Below detectable levels | Below detectable levels | NA | Below detectable levels | -- |
| April 24 | All Below | NA | Below detectable levels | Below detectable levels | NA | Below detectable levels | -- |
| April 26 | All Below | NA | NA | Below detectable levels | Below detectable levels | Below detectable levels | -- |
| April 27 | All Below | Below detectable levels | NA | Below detectable levels | NA | Below detectable levels | -- |
| April 28 | All Below | Below detectable levels | NA | Below detectable levels | NA | Below detectable levels | -- |
| April 30 | All Below | Below detectable levels | NA | Below detectable levels | NA | Below detectable levels | -- |
Total PCBs (micrograms per liter)
Return to top for lab results from previous months
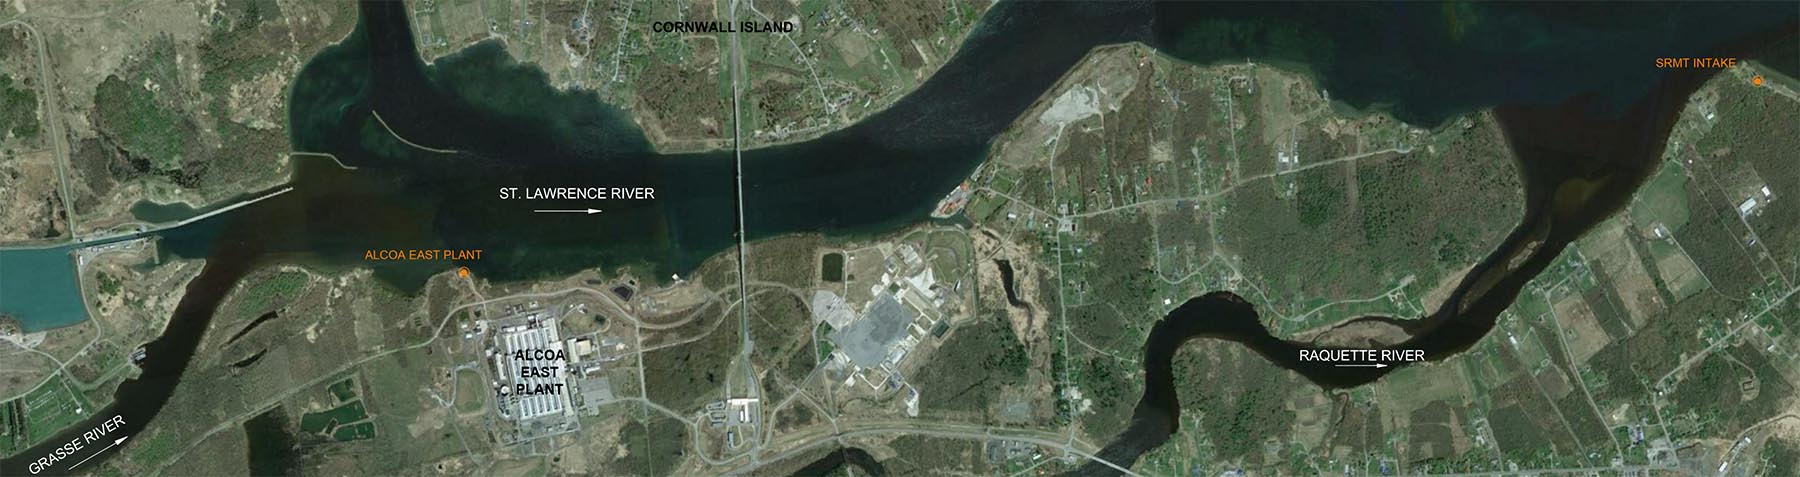
2021 Water Intake Turbidity Data (Corrective Action Level = 25 NTU above Baseline Level)
| Monitoring Station ID (see figure) | |||||
|---|---|---|---|---|---|
| Date | Action Level Check | IN-AE-RAW | IN-SRMT-RAW | IN-SRMT-FIL | Notes |
| April 6 | All Below | 1.1 | 1.3 | 0.2 | Baseline monitoring event |
| April 7 | All Below | 0.8 | 1.1 | 0.2 | -- |
| April 8 | All Below | 1.1 | 1.3 | 0.2 | -- |
| April 9 | All Below | 1.0 | 1.1 | 0.2 | -- |
| April 10 | All Below | 1.1 | 1.1 | 0.1 | -- |
| April 12 | All Below | 1.1 | 1.9 | 0.1 | -- |
| April 13 | All Below | 1.3 | 0.9 | 0.2 | -- |
| April 14 | All Below | 2.1 | 1.0 | 0.2 | -- |
| April 15 | All Below | 0.9 | 1.0 | 0.3 | -- |
| April 16 | All Below | 0.8 | 1.1 | 0.1 | -- |
| April 17 | All Below | 0.8 | 1.1 | 0.1 | -- |
| April 19 | All Below | 0.7 | 1.1 | 0.1 | -- |
| April 20 | All Below | 0.7 | 0.7 | 0.1 | -- |
| April 21 | All Below | 0.8 | 0.7 | 0.2 | -- |
| April 22 | All Below | 0.8 | 0.6 | 0.2 | -- |
| April 23 | All Below | 1.3 | 0.9 | 0.0 | -- |
| April 24 | All Below | 0.9 | 0.8 | 0.1 | -- |
| April 26 | All Below | 0.8 | 0.7 | 0.3 | -- |
| April 27 | All Below | 0.3 | 0.7 | 0.1 | -- |
| April 28 | All Below | 1.2 | 1.7 | 0.1 | -- |
| April 29 | All Below | 0.7 | 0.9 | 0.2 | -- |
| April 30 | All Below | 0.8 | 0.9 | 0.1 | -- |
Turbidity (Nephelometric Turbidity Unit)
Return to top for lab results from previous months
2021 Water Intake PCB Data (Corrective Action Level at WC-SLR = 0.5 microgram per liter)
| Monitoring Station ID (see figure) | |||||
|---|---|---|---|---|---|
| Date | Action Level Check | WC-AW-RAW | WC-SRMT-RAW | WC-SRMT-FIL | Notes |
| April 7 | All Below | Below detectable levels | Below detectable levels | Below detectable levels | -- |
| April 8 | All Below | Below detectable levels | Below detectable levels | Below detectable levels | -- |
| April 9 | All Below | Below detectable levels | Below detectable levels | Below detectable levels | -- |
| April 10 | All Below | Below detectable levels | Below detectable levels | Below detectable levels | -- |
| April 12 | All Below | Below detectable levels | Below detectable levels | Below detectable levels | -- |
| April 13 | All Below | Below detectable levels | Below detectable levels | Below detectable levels | -- |
| April 14 | All Below | Below detectable levels | Below detectable levels | Below detectable levels | -- |
| April 15 | All Below | Below detectable levels | Below detectable levels | Below detectable levels | -- |
| April 16 | All Below | Below detectable levels | Below detectable levels | Below detectable levels | -- |
| April 17 | All Below | Below detectable levels | Below detectable levels | Below detectable levels | -- |
| April 19 | All Below | Below detectable levels | Below detectable levels | Below detectable levels | -- |
| April 20 | All Below | Below detectable levels | Below detectable levels | Below detectable levels | -- |
| April 21 | All Below | Below detectable levels | Below detectable levels | Below detectable levels | -- |
| April 22 | All Below | Below detectable levels | Below detectable levels | Below detectable levels | -- |
| April 23 | All Below | Below detectable levels | Below detectable levels | Below detectable levels | -- |
| April 24 | All Below | Below detectable levels | Below detectable levels | Below detectable levels | -- |
| April 26 | All Below | Below detectable levels | Below detectable levels | Below detectable levels | -- |
| April 27 | All Below | Below detectable levels | Below detectable levels | Below detectable levels | -- |
| April 28 | All Below | Below detectable levels | Below detectable levels | Below detectable levels | -- |
| April 30 | All Below | Below detectable levels | Below detectable levels | Below detectable levels | -- |
Total PCBs (micrograms per liter)
Return to top for lab results from previous months