Since the early 1990s, Arconic (formerly Alcoa) has collected over 2,300 water column and 3,600 resident fish samples from the lower Grasse River to examine how PCB levels in the lower Grasse River have changed over time, and to identify what impacts naturally occurring events (such as high flow events and ice jams) and major in-river pilot studies have had on the recovery of the lower Grasse River. The findings from this monitoring are provided below. An overview of the monitoring activities is provided in Water Column Monitoring and Resident Fish Monitoring. The historical results summarized here will be updated in the future with the long-term monitoring results to assess changes over time following completion of the EPA’s cleanup plan.
The water column and resident fish data indicate that PCB levels in the river have dramatically declined since the early to mid-1990s (see figures below). This decline is likely due to two factors:
- A downward trend in water column PCB concentrations resulting from the land-based remediation efforts performed on Alcoa plant site property between 1990 and 2001 that significantly reduced the PCB discharges to the river (see Land-Based Remediation Activities) and
- Natural recovery due to “clean” solids that continually enter the river from upstream and deposit on top of the PCB-containing sediments, reducing the movement of PCBs to the water column and fish.
This decline continued through 2004, despite the approximate 1-in-100 year high flow event that occurred in January 1998, the construction activities associated with the 2001 Capping Pilot Study, and the severe ice jam event that occurred in 2003 (see Ice Management Evaluation). Although some local impacts to fish collected from the portion of the river where the 2003 ice jam event occurred, the uninterrupted decline during this period indicates that these events did not have significant adverse effects on river-wide PCB levels in the water and resident fish. In 2005, the sediment removal activities performed as part of the Remedial Options Pilot Study caused significant increases in both water column and resident fish PCBs. These increases, however, only resulted in the short-term interruption of the decline observed prior to 2004; PCB levels measured in 2006 and 2007 were similar to those measured in the few years prior to the 2005 ROPS. The similarity of the PCB levels measured in 2006 and 2007 to those from 2004 also indicate that the construction activities associated with the Activated Carbon Pilot Study did not cause any adverse impacts to the river. Levels measured since 2007 continue to be low and support the declines observed since the 1990s.
Changes in Summertime Average Water Column PCBs (ppt)

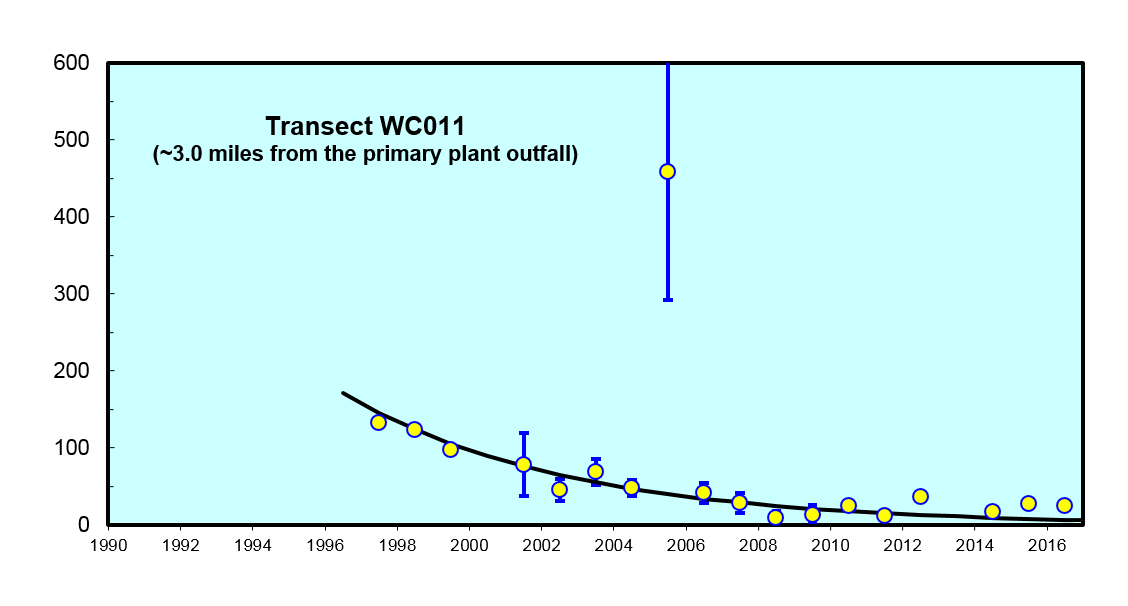
ppt stands for parts per trillion, which is a measure of concentration often used to express levels of contaminants in water. It is computed as the mass of contaminant in the water sample divided by the volume of the water sample. For example, 0.000000001 grams of PCB in one liter of water equals 1 ppt.
Changes in Average Fish Tissue PCBs (ppm) from the Middle Stretch
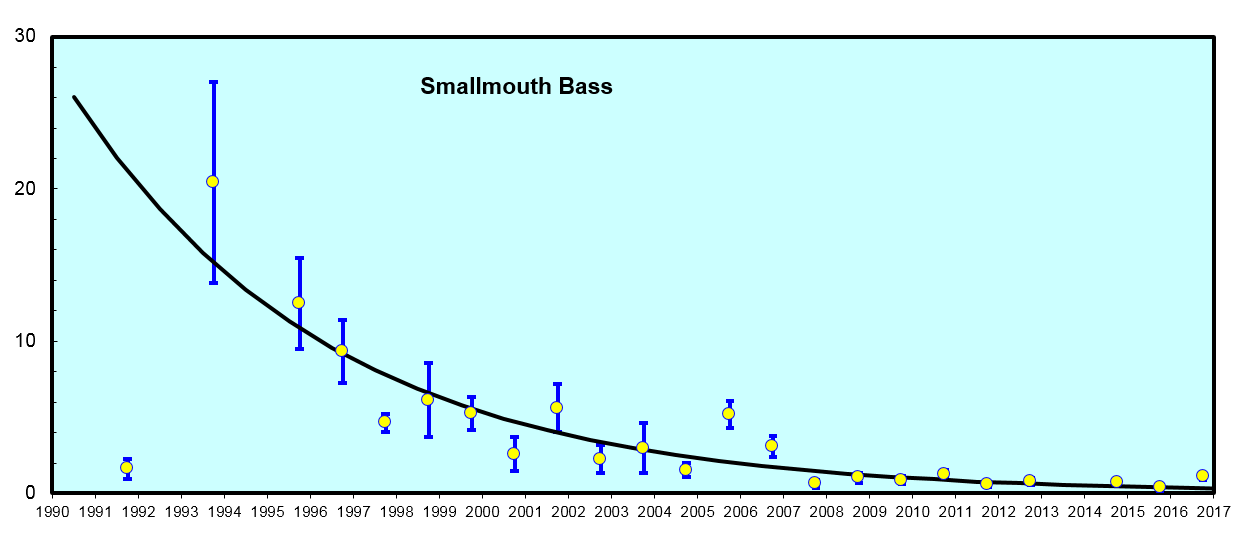
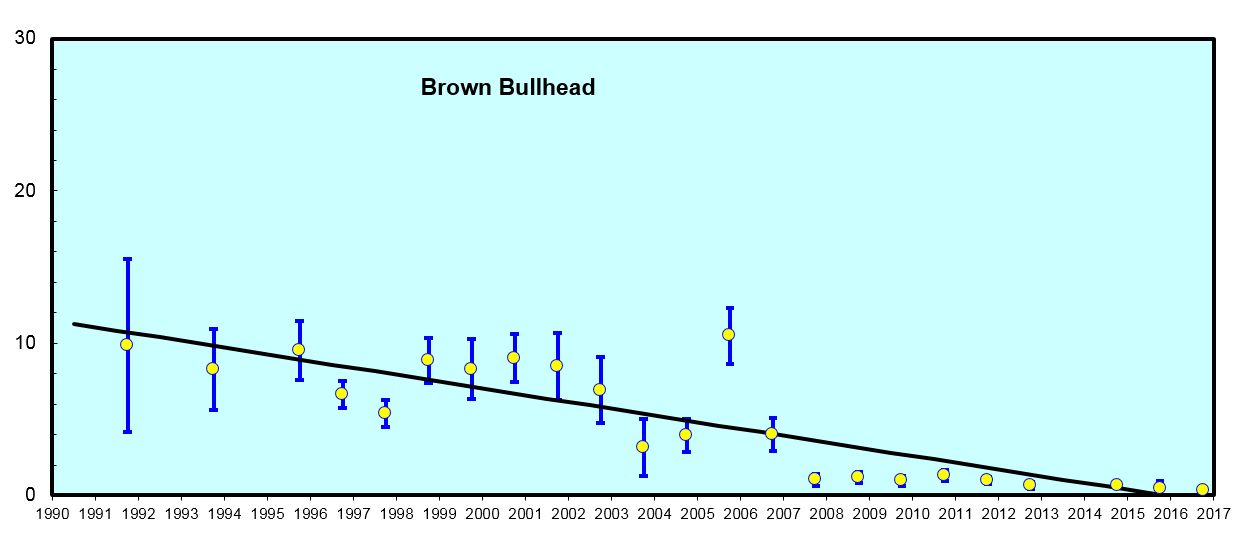
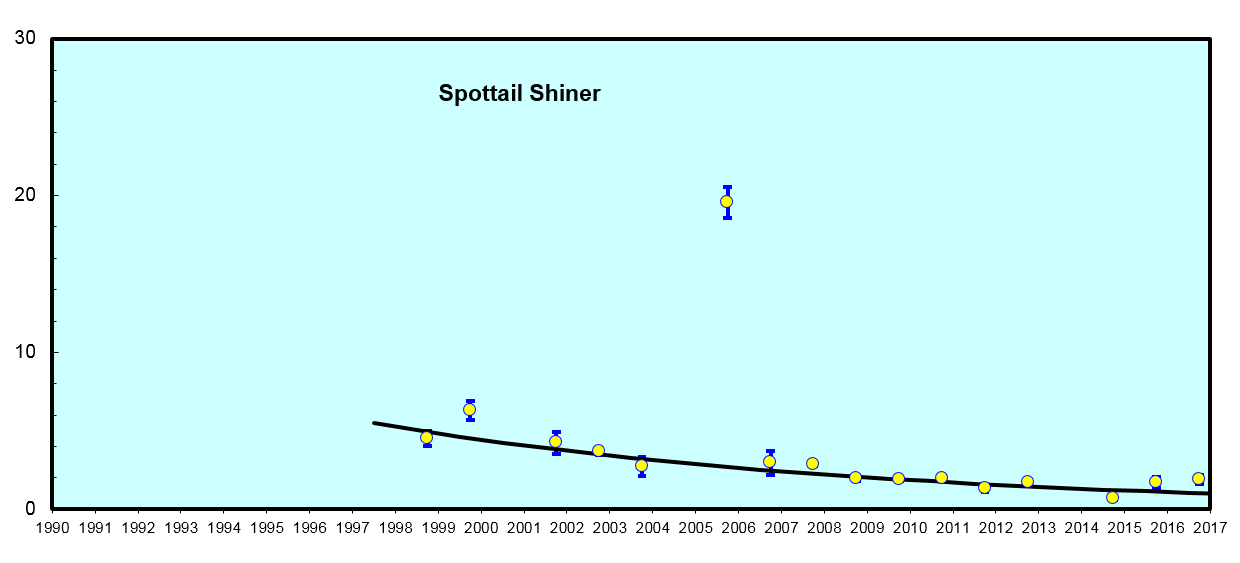
ppm stands for parts per million, which is a measure of concentration often used to express levels of contaminants in fish tissue samples. It is computed as the mass of contaminant in the fish tissue sample divided by the mass of the fish tissue sample. For example, 0.000001 grams of PCB in one gram of fish tissue sample equals 1 ppm.